


|
|
| Operation Type | Operation Subcategory | Procedures Recorded for this Surgeon | National Average |
|---|---|---|---|
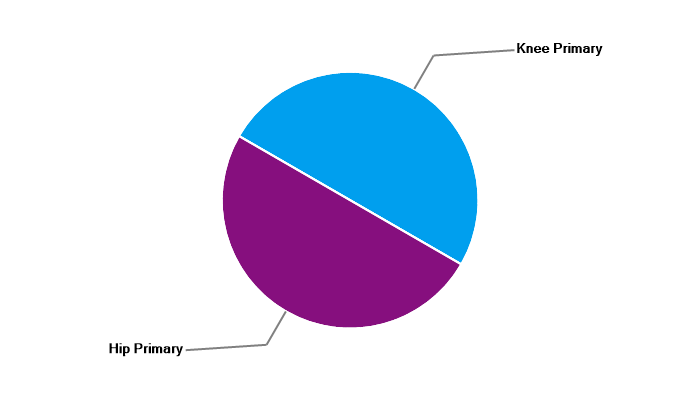
| Hip Primary | - | Fewer Than 5 | 61 |
| Knee Primary | Total knee replacement | Fewer Than 5 | 56 |
| Total | - | 0+ | 117 |
| Time from first procedure submitted to the NJR as Consultant in Charge | More than 36 months |

| Operation Type | Operation Subcategory | Procedures Recorded for this Surgeon | National Average |
|---|---|---|---|
| Hip Primary | - | Fewer Than 5 | 124 |
| Knee Primary | Total knee replacement | Fewer Than 5 | 115 |
| Total | - | 0+ | 239 |
| Time from first procedure submitted to the NJR as Consultant in Charge | More than 36 months |

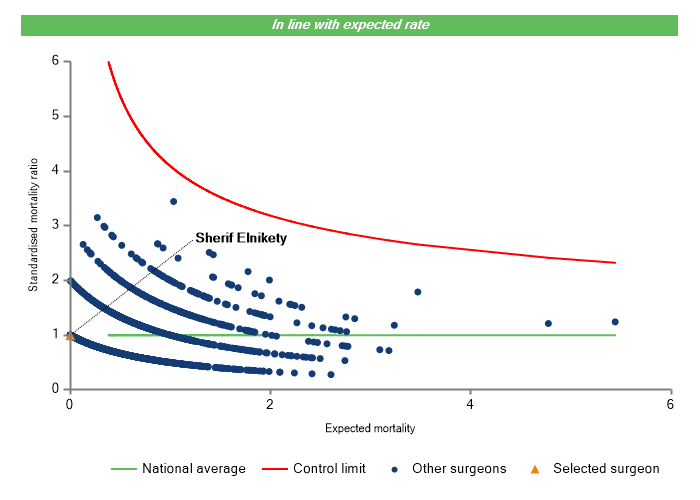
What does this mean?
This shows 90-day mortality following hip surgery for this surgeon, based on the type of patients this surgeon has seen.
The surgeon you are reviewing is highlighted as an orange triangle. Progression along the horizontal axis (x axis) means that the surgeon has done more cases and/or cases at a higher mortality risk such as older patients. Progression along the vertical axis (y axis) means the surgeon has had more deaths.
The vertical axis figures are presented as a standardised mortality ratio. This means the values do not represent percentages of patients who have died, but they represent the proportion of deaths compared to the national average. The data is also risk adjusted to take account of the fact that different surgeons may operate on more higher-risk or lower-risk patients e.g. because of demographics in the patient population they work with.
The overall 90-day mortality rate following primary hip replacement surgery is approximately 0.24%.